Will Nexalin Technology (NASDAQ:NXL) Spend Its Cash Wisely?
Even when a business is losing money, it's possible for shareholders to make money if they buy a good business at the right price. Indeed, Nexalin Technology (NASDAQ:NXL) stock is up 261% in the last year, providing strong gains for shareholders. Having said that, unprofitable companies are risky because they could potentially burn through all their cash and become distressed.
In light of its strong share price run, we think now is a good time to investigate how risky Nexalin Technology's cash burn is. In this article, we define cash burn as its annual (negative) free cash flow, which is the amount of money a company spends each year to fund its growth. We'll start by comparing its cash burn with its cash reserves in order to calculate its cash runway.
See our latest analysis for Nexalin Technology
When Might Nexalin Technology Run Out Of Money?
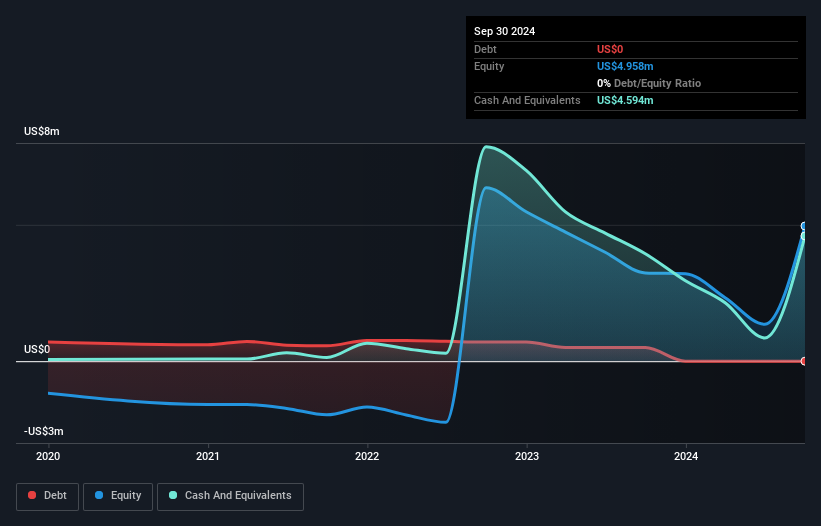
A cash runway is defined as the length of time it would take a company to run out of money if it kept spending at its current rate of cash burn. As at September 2024, Nexalin Technology had cash of US$4.6m and no debt. In the last year, its cash burn was US$3.9m. That means it had a cash runway of around 14 months as of September 2024. That's not too bad, but it's fair to say the end of the cash runway is in sight, unless cash burn reduces drastically. The image below shows how its cash balance has been changing over the last few years.
How Is Nexalin Technology's Cash Burn Changing Over Time?
Whilst it's great to see that Nexalin Technology has already begun generating revenue from operations, last year it only produced US$162k, so we don't think it is generating significant revenue, at this point. Therefore, for the purposes of this analysis we'll focus on how the cash burn is tracking. It seems likely that the business is content with its current spending, as the cash burn rate stayed steady over the last twelve months. While the past is always worth studying, it is the future that matters most of all. So you might want to take a peek at how much the company is expected to grow in the next few years.
Can Nexalin Technology Raise More Cash Easily?
While Nexalin Technology is showing a solid reduction in its cash burn, it's still worth considering how easily it could raise more cash, even just to fuel faster growth. Companies can raise capital through either debt or equity. Many companies end up issuing new shares to fund future growth. By comparing a company's annual cash burn to its total market capitalisation, we can estimate roughly how many shares it would have to issue in order to run the company for another year (at the same burn rate).
Since it has a market capitalisation of US$29m, Nexalin Technology's US$3.9m in cash burn equates to about 14% of its market value. Given that situation, it's fair to say the company wouldn't have much trouble raising more cash for growth, but shareholders would be somewhat diluted.
So, Should We Worry About Nexalin Technology's Cash Burn?
The good news is that in our view Nexalin Technology's cash burn situation gives shareholders real reason for optimism. Not only was its cash runway quite good, but its cash burn relative to its market cap was a real positive. We don't think its cash burn is particularly problematic, but after considering the range of factors in this article, we do think shareholders should be monitoring how it changes over time. On another note, we conducted an in-depth investigation of the company, and identified 5 warning signs for Nexalin Technology (2 are potentially serious!) that you should be aware of before investing here.
Of course Nexalin Technology may not be the best stock to buy. So you may wish to see this free collection of companies boasting high return on equity, or this list of stocks with high insider ownership.
If you're looking to trade Nexalin Technology, open an account with the lowest-cost platform trusted by professionals, Interactive Brokers.
With clients in over 200 countries and territories, and access to 160 markets, IBKR lets you trade stocks, options, futures, forex, bonds and funds from a single integrated account.
Enjoy no hidden fees, no account minimums, and FX conversion rates as low as 0.03%, far better than what most brokers offer.
Sponsored ContentValuation is complex, but we're here to simplify it.
Discover if Nexalin Technology might be undervalued or overvalued with our detailed analysis, featuring fair value estimates, potential risks, dividends, insider trades, and its financial condition.
Access Free AnalysisHave feedback on this article? Concerned about the content? Get in touch with us directly. Alternatively, email editorial-team (at) simplywallst.com.This article by Simply Wall St is general in nature. We provide commentary based on historical data and analyst forecasts only using an unbiased methodology and our articles are not intended to be financial advice. It does not constitute a recommendation to buy or sell any stock, and does not take account of your objectives, or your financial situation. We aim to bring you long-term focused analysis driven by fundamental data. Note that our analysis may not factor in the latest price-sensitive company announcements or qualitative material. Simply Wall St has no position in any stocks mentioned.
Disclaimer: Investing carries risk. This is not financial advice. The above content should not be regarded as an offer, recommendation, or solicitation on acquiring or disposing of any financial products, any associated discussions, comments, or posts by author or other users should not be considered as such either. It is solely for general information purpose only, which does not consider your own investment objectives, financial situations or needs. TTM assumes no responsibility or warranty for the accuracy and completeness of the information, investors should do their own research and may seek professional advice before investing.
Most Discussed
- 1
- 2
- 3
- 4
- 5
- 6
- 7
- 8
- 9
- 10