Yestar Healthcare Holdings' (HKG:2393) Returns On Capital Tell Us There Is Reason To Feel Uneasy
If you're looking at a mature business that's past the growth phase, what are some of the underlying trends that pop up? Typically, we'll see the trend of both return on capital employed (ROCE) declining and this usually coincides with a decreasing amount of capital employed. This indicates the company is producing less profit from its investments and its total assets are decreasing. And from a first read, things don't look too good at Yestar Healthcare Holdings (HKG:2393), so let's see why.
What Is Return On Capital Employed (ROCE)?
Just to clarify if you're unsure, ROCE is a metric for evaluating how much pre-tax income (in percentage terms) a company earns on the capital invested in its business. The formula for this calculation on Yestar Healthcare Holdings is:
Return on Capital Employed = Earnings Before Interest and Tax (EBIT) ÷ (Total Assets - Current Liabilities)
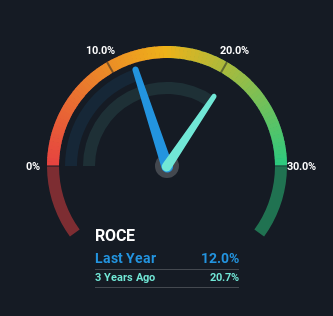
0.12 = CN¥95m ÷ (CN¥1.8b - CN¥1.0b) (Based on the trailing twelve months to June 2024).
So, Yestar Healthcare Holdings has an ROCE of 12%. In absolute terms, that's a satisfactory return, but compared to the Medical Equipment industry average of 8.6% it's much better.
Check out our latest analysis for Yestar Healthcare Holdings
While the past is not representative of the future, it can be helpful to know how a company has performed historically, which is why we have this chart above. If you want to delve into the historical earnings , check out these free graphs detailing revenue and cash flow performance of Yestar Healthcare Holdings.
What The Trend Of ROCE Can Tell Us
We are a bit anxious about the trends of ROCE at Yestar Healthcare Holdings. The company used to generate 23% on its capital five years ago but it has since fallen noticeably. What's equally concerning is that the amount of capital deployed in the business has shrunk by 74% over that same period. When you see both ROCE and capital employed diminishing, it can often be a sign of a mature and shrinking business that might be in structural decline. If these underlying trends continue, we wouldn't be too optimistic going forward.
Another thing to note, Yestar Healthcare Holdings has a high ratio of current liabilities to total assets of 57%. This effectively means that suppliers (or short-term creditors) are funding a large portion of the business, so just be aware that this can introduce some elements of risk. Ideally we'd like to see this reduce as that would mean fewer obligations bearing risks.
What We Can Learn From Yestar Healthcare Holdings' ROCE
To see Yestar Healthcare Holdings reducing the capital employed in the business in tandem with diminishing returns, is concerning. We expect this has contributed to the stock plummeting 93% during the last five years. With underlying trends that aren't great in these areas, we'd consider looking elsewhere.
One more thing: We've identified 2 warning signs with Yestar Healthcare Holdings (at least 1 which doesn't sit too well with us) , and understanding them would certainly be useful.
For those who like to invest in solid companies, check out this free list of companies with solid balance sheets and high returns on equity.
If you're looking to trade Yestar Healthcare Holdings, open an account with the lowest-cost platform trusted by professionals, Interactive Brokers.
With clients in over 200 countries and territories, and access to 160 markets, IBKR lets you trade stocks, options, futures, forex, bonds and funds from a single integrated account.
Enjoy no hidden fees, no account minimums, and FX conversion rates as low as 0.03%, far better than what most brokers offer.
Sponsored ContentNew: Manage All Your Stock Portfolios in One Place
We've created the ultimate portfolio companion for stock investors, and it's free.
• Connect an unlimited number of Portfolios and see your total in one currency• Be alerted to new Warning Signs or Risks via email or mobile• Track the Fair Value of your stocks
Try a Demo Portfolio for FreeHave feedback on this article? Concerned about the content? Get in touch with us directly. Alternatively, email editorial-team (at) simplywallst.com.This article by Simply Wall St is general in nature. We provide commentary based on historical data and analyst forecasts only using an unbiased methodology and our articles are not intended to be financial advice. It does not constitute a recommendation to buy or sell any stock, and does not take account of your objectives, or your financial situation. We aim to bring you long-term focused analysis driven by fundamental data. Note that our analysis may not factor in the latest price-sensitive company announcements or qualitative material. Simply Wall St has no position in any stocks mentioned.
Disclaimer: Investing carries risk. This is not financial advice. The above content should not be regarded as an offer, recommendation, or solicitation on acquiring or disposing of any financial products, any associated discussions, comments, or posts by author or other users should not be considered as such either. It is solely for general information purpose only, which does not consider your own investment objectives, financial situations or needs. TTM assumes no responsibility or warranty for the accuracy and completeness of the information, investors should do their own research and may seek professional advice before investing.
Most Discussed
- 1
- 2
- 3
- 4
- 5
- 6
- 7
- 8
- 9
- 10