Some Investors May Be Worried About Geely Automobile Holdings' (HKG:175) Returns On Capital
There are a few key trends to look for if we want to identify the next multi-bagger. Firstly, we'd want to identify a growing return on capital employed (ROCE) and then alongside that, an ever-increasing base of capital employed. Put simply, these types of businesses are compounding machines, meaning they are continually reinvesting their earnings at ever-higher rates of return. In light of that, when we looked at Geely Automobile Holdings (HKG:175) and its ROCE trend, we weren't exactly thrilled.
Return On Capital Employed (ROCE): What Is It?
Just to clarify if you're unsure, ROCE is a metric for evaluating how much pre-tax income (in percentage terms) a company earns on the capital invested in its business. To calculate this metric for Geely Automobile Holdings, this is the formula:
Return on Capital Employed = Earnings Before Interest and Tax (EBIT) ÷ (Total Assets - Current Liabilities)
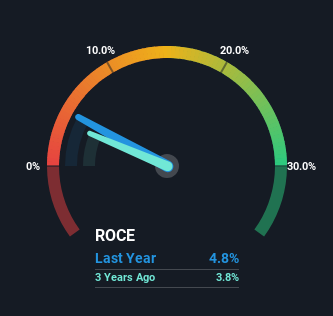
0.048 = CN¥5.3b ÷ (CN¥216b - CN¥105b) (Based on the trailing twelve months to September 2024).
Therefore, Geely Automobile Holdings has an ROCE of 4.8%. In absolute terms, that's a low return and it also under-performs the Auto industry average of 12%.
See our latest analysis for Geely Automobile Holdings
In the above chart we have measured Geely Automobile Holdings' prior ROCE against its prior performance, but the future is arguably more important. If you'd like to see what analysts are forecasting going forward, you should check out our free analyst report for Geely Automobile Holdings .
So How Is Geely Automobile Holdings' ROCE Trending?
On the surface, the trend of ROCE at Geely Automobile Holdings doesn't inspire confidence. Over the last five years, returns on capital have decreased to 4.8% from 15% five years ago. Although, given both revenue and the amount of assets employed in the business have increased, it could suggest the company is investing in growth, and the extra capital has led to a short-term reduction in ROCE. And if the increased capital generates additional returns, the business, and thus shareholders, will benefit in the long run.
Another thing to note, Geely Automobile Holdings has a high ratio of current liabilities to total assets of 49%. This can bring about some risks because the company is basically operating with a rather large reliance on its suppliers or other sorts of short-term creditors. Ideally we'd like to see this reduce as that would mean fewer obligations bearing risks.
The Bottom Line
In summary, despite lower returns in the short term, we're encouraged to see that Geely Automobile Holdings is reinvesting for growth and has higher sales as a result. In light of this, the stock has only gained 36% over the last five years. So this stock may still be an appealing investment opportunity, if other fundamentals prove to be sound.
One more thing, we've spotted 1 warning sign facing Geely Automobile Holdings that you might find interesting.
For those who like to invest in solid companies, check out this free list of companies with solid balance sheets and high returns on equity.
New: Manage All Your Stock Portfolios in One Place
We've created the ultimate portfolio companion for stock investors, and it's free.
• Connect an unlimited number of Portfolios and see your total in one currency• Be alerted to new Warning Signs or Risks via email or mobile• Track the Fair Value of your stocks
Try a Demo Portfolio for FreeHave feedback on this article? Concerned about the content? Get in touch with us directly. Alternatively, email editorial-team (at) simplywallst.com.This article by Simply Wall St is general in nature. We provide commentary based on historical data and analyst forecasts only using an unbiased methodology and our articles are not intended to be financial advice. It does not constitute a recommendation to buy or sell any stock, and does not take account of your objectives, or your financial situation. We aim to bring you long-term focused analysis driven by fundamental data. Note that our analysis may not factor in the latest price-sensitive company announcements or qualitative material. Simply Wall St has no position in any stocks mentioned.
Disclaimer: Investing carries risk. This is not financial advice. The above content should not be regarded as an offer, recommendation, or solicitation on acquiring or disposing of any financial products, any associated discussions, comments, or posts by author or other users should not be considered as such either. It is solely for general information purpose only, which does not consider your own investment objectives, financial situations or needs. TTM assumes no responsibility or warranty for the accuracy and completeness of the information, investors should do their own research and may seek professional advice before investing.
Most Discussed
- 1
- 2
- 3
- 4
- 5
- 6
- 7
- 8
- 9
- 10