Could Telstra Group Limited's (ASX:TLS) Weak Financials Mean That The Market Could Correct Its Share Price?
Telstra Group's (ASX:TLS) stock up by 5.2% over the past three months. However, its weak financial performance indicators makes us a bit doubtful if that trend could continue. In this article, we decided to focus on Telstra Group's ROE.
ROE or return on equity is a useful tool to assess how effectively a company can generate returns on the investment it received from its shareholders. Put another way, it reveals the company's success at turning shareholder investments into profits.
Check out our latest analysis for Telstra Group
How Is ROE Calculated?
ROE can be calculated by using the formula:
Return on Equity = Net Profit (from continuing operations) ÷ Shareholders' Equity
So, based on the above formula, the ROE for Telstra Group is:
10% = AU$1.8b ÷ AU$17b (Based on the trailing twelve months to June 2024).
The 'return' refers to a company's earnings over the last year. That means that for every A$1 worth of shareholders' equity, the company generated A$0.10 in profit.
What Has ROE Got To Do With Earnings Growth?
So far, we've learned that ROE is a measure of a company's profitability. Depending on how much of these profits the company reinvests or "retains", and how effectively it does so, we are then able to assess a company’s earnings growth potential. Assuming all else is equal, companies that have both a higher return on equity and higher profit retention are usually the ones that have a higher growth rate when compared to companies that don't have the same features.
Telstra Group's Earnings Growth And 10% ROE
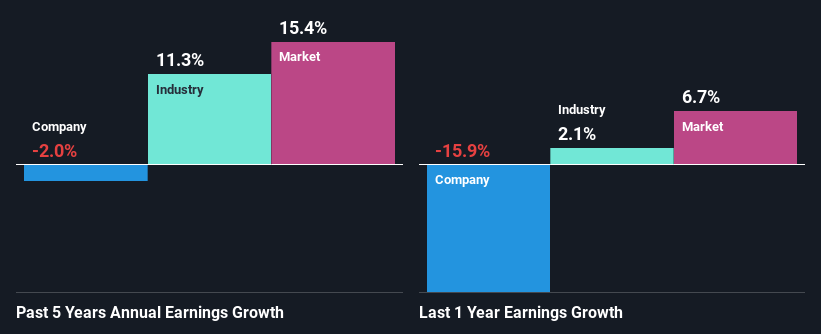
At first glance, Telstra Group's ROE doesn't look very promising. However, given that the company's ROE is similar to the average industry ROE of 10%, we may spare it some thought. Still, Telstra Group has seen a flat net income growth over the past five years. Remember, the company's ROE is not particularly great to begin with. Hence, this provides some context to the flat earnings growth seen by the company.
We then compared Telstra Group's net income growth with the industry and found that the average industry growth rate was 11% in the same 5-year period.
Earnings growth is an important metric to consider when valuing a stock. What investors need to determine next is if the expected earnings growth, or the lack of it, is already built into the share price. This then helps them determine if the stock is placed for a bright or bleak future. If you're wondering about Telstra Group's's valuation, check out this gauge of its price-to-earnings ratio, as compared to its industry.
Is Telstra Group Efficiently Re-investing Its Profits?
With a high three-year median payout ratio of 99% (implying that the company keeps only 0.6% of its income) of its business to reinvest into its business), most of Telstra Group's profits are being paid to shareholders, which explains the absence of growth in earnings.
Moreover, Telstra Group has been paying dividends for at least ten years or more suggesting that management must have perceived that the shareholders prefer dividends over earnings growth. Based on the latest analysts' estimates, we found that the company's future payout ratio over the next three years is expected to hold steady at 93%. Still, forecasts suggest that Telstra Group's future ROE will rise to 17% even though the the company's payout ratio is not expected to change by much.
Conclusion
In total, we would have a hard think before deciding on any investment action concerning Telstra Group. The low ROE, combined with the fact that the company is paying out almost if not all, of its profits as dividends, has resulted in the lack or absence of growth in its earnings. Having said that, looking at current analyst estimates, we found that the company's earnings growth rate is expected to see a huge improvement. Are these analysts expectations based on the broad expectations for the industry, or on the company's fundamentals? Click here to be taken to our analyst's forecasts page for the company.
Valuation is complex, but we're here to simplify it.
Discover if Telstra Group might be undervalued or overvalued with our detailed analysis, featuring fair value estimates, potential risks, dividends, insider trades, and its financial condition.
Access Free AnalysisHave feedback on this article? Concerned about the content? Get in touch with us directly. Alternatively, email editorial-team (at) simplywallst.com.This article by Simply Wall St is general in nature. We provide commentary based on historical data and analyst forecasts only using an unbiased methodology and our articles are not intended to be financial advice. It does not constitute a recommendation to buy or sell any stock, and does not take account of your objectives, or your financial situation. We aim to bring you long-term focused analysis driven by fundamental data. Note that our analysis may not factor in the latest price-sensitive company announcements or qualitative material. Simply Wall St has no position in any stocks mentioned.
Disclaimer: Investing carries risk. This is not financial advice. The above content should not be regarded as an offer, recommendation, or solicitation on acquiring or disposing of any financial products, any associated discussions, comments, or posts by author or other users should not be considered as such either. It is solely for general information purpose only, which does not consider your own investment objectives, financial situations or needs. TTM assumes no responsibility or warranty for the accuracy and completeness of the information, investors should do their own research and may seek professional advice before investing.
Most Discussed
- 1
- 2
- 3
- 4
- 5
- 6
- 7
- 8
- 9
- 10