Mantra (OM) Price Stalls 10% Below All-Time High as Bullish Momentum Fades
- Mantra (OM) sees 183% growth in 30 days but faces weakening momentum as technical indicators turn mixed.
- ADX signals a fading trend with potential consolidation if momentum does not recover.
- Ichimoku Cloud shows bullish price positioning but limited strength as bearish signals emerge.
Mantra (OM) price has seen remarkable growth, up 183.20% in the last 30 days. On November 18, OM reached a new all-time high, and it currently trades roughly 10% below that level.
Despite its impressive performance, technical indicators suggest that its trend is losing momentum. Whether OM breaks resistance to test new highs or faces a potential correction depends on how the current mixed signals evolve.
OM’s Trend Is Fading Away
Mantra Average Directional Index (ADX) is currently at 21.6, a sharp decline from 35 just a day ago. This drop indicates that the strength of OM’s uptrend is weakening, even though the price is still moving upward.
A lower ADX reading suggests that while the trend remains intact, it may lack the momentum needed to sustain significant gains. If the ADX continues to decline, the uptrend could falter, leaving OM vulnerable to a potential consolidation or reversal.
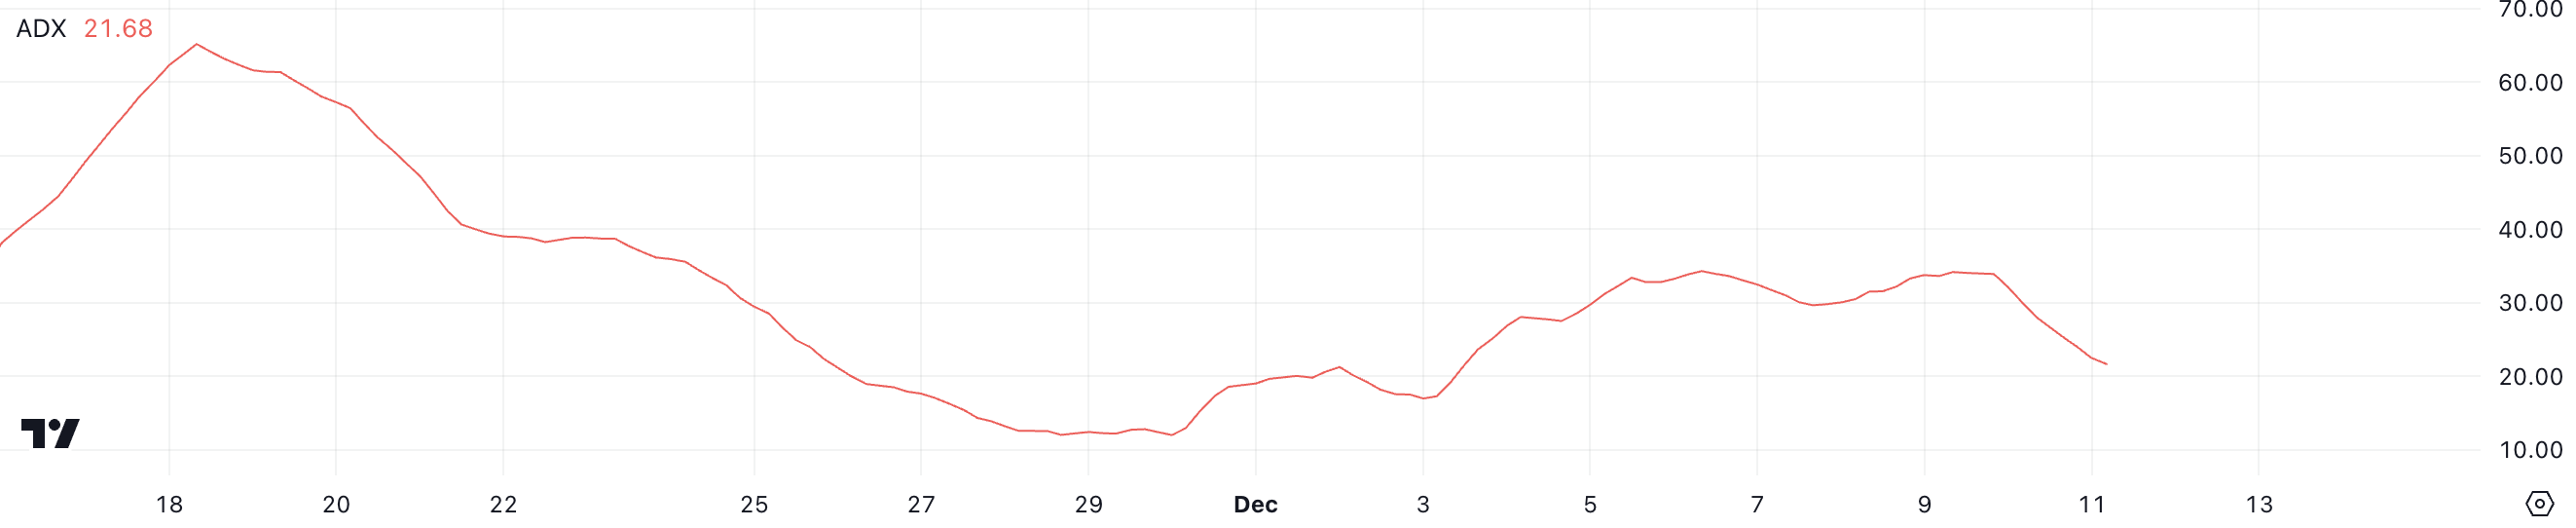
The ADX measures the strength of a trend, with values above 25 indicating a strong trend and below 20 suggesting a weak or no trend. At 21.6, OM’s ADX is in the transitional zone, signaling that the uptrend is losing steam but has not yet completely dissipated.
For OM price to maintain its upward trajectory, the ADX would need to rise back above 25, reflecting a resurgence in momentum. If the ADX stabilizes around current levels, the price may consolidate or see slower progress, highlighting the need for renewed buying interest to sustain the uptrend.
Ichimoku Cloud Shows Cautious Next Steps for Mantra
The Ichimoku Cloud for OM is currently showing mixed signals. The price is above the cloud, which generally indicates a bullish trend, but the cloud itself appears flat, suggesting limited momentum.
The blue line (Tenkan-sen) has crossed below the red line (Kijun-sen), which is a bearish signal. However, the green cloud ahead suggests that Mantra price could still maintain its upward trajectory if RWA (Real-World Assets) narrative recovers its hype.
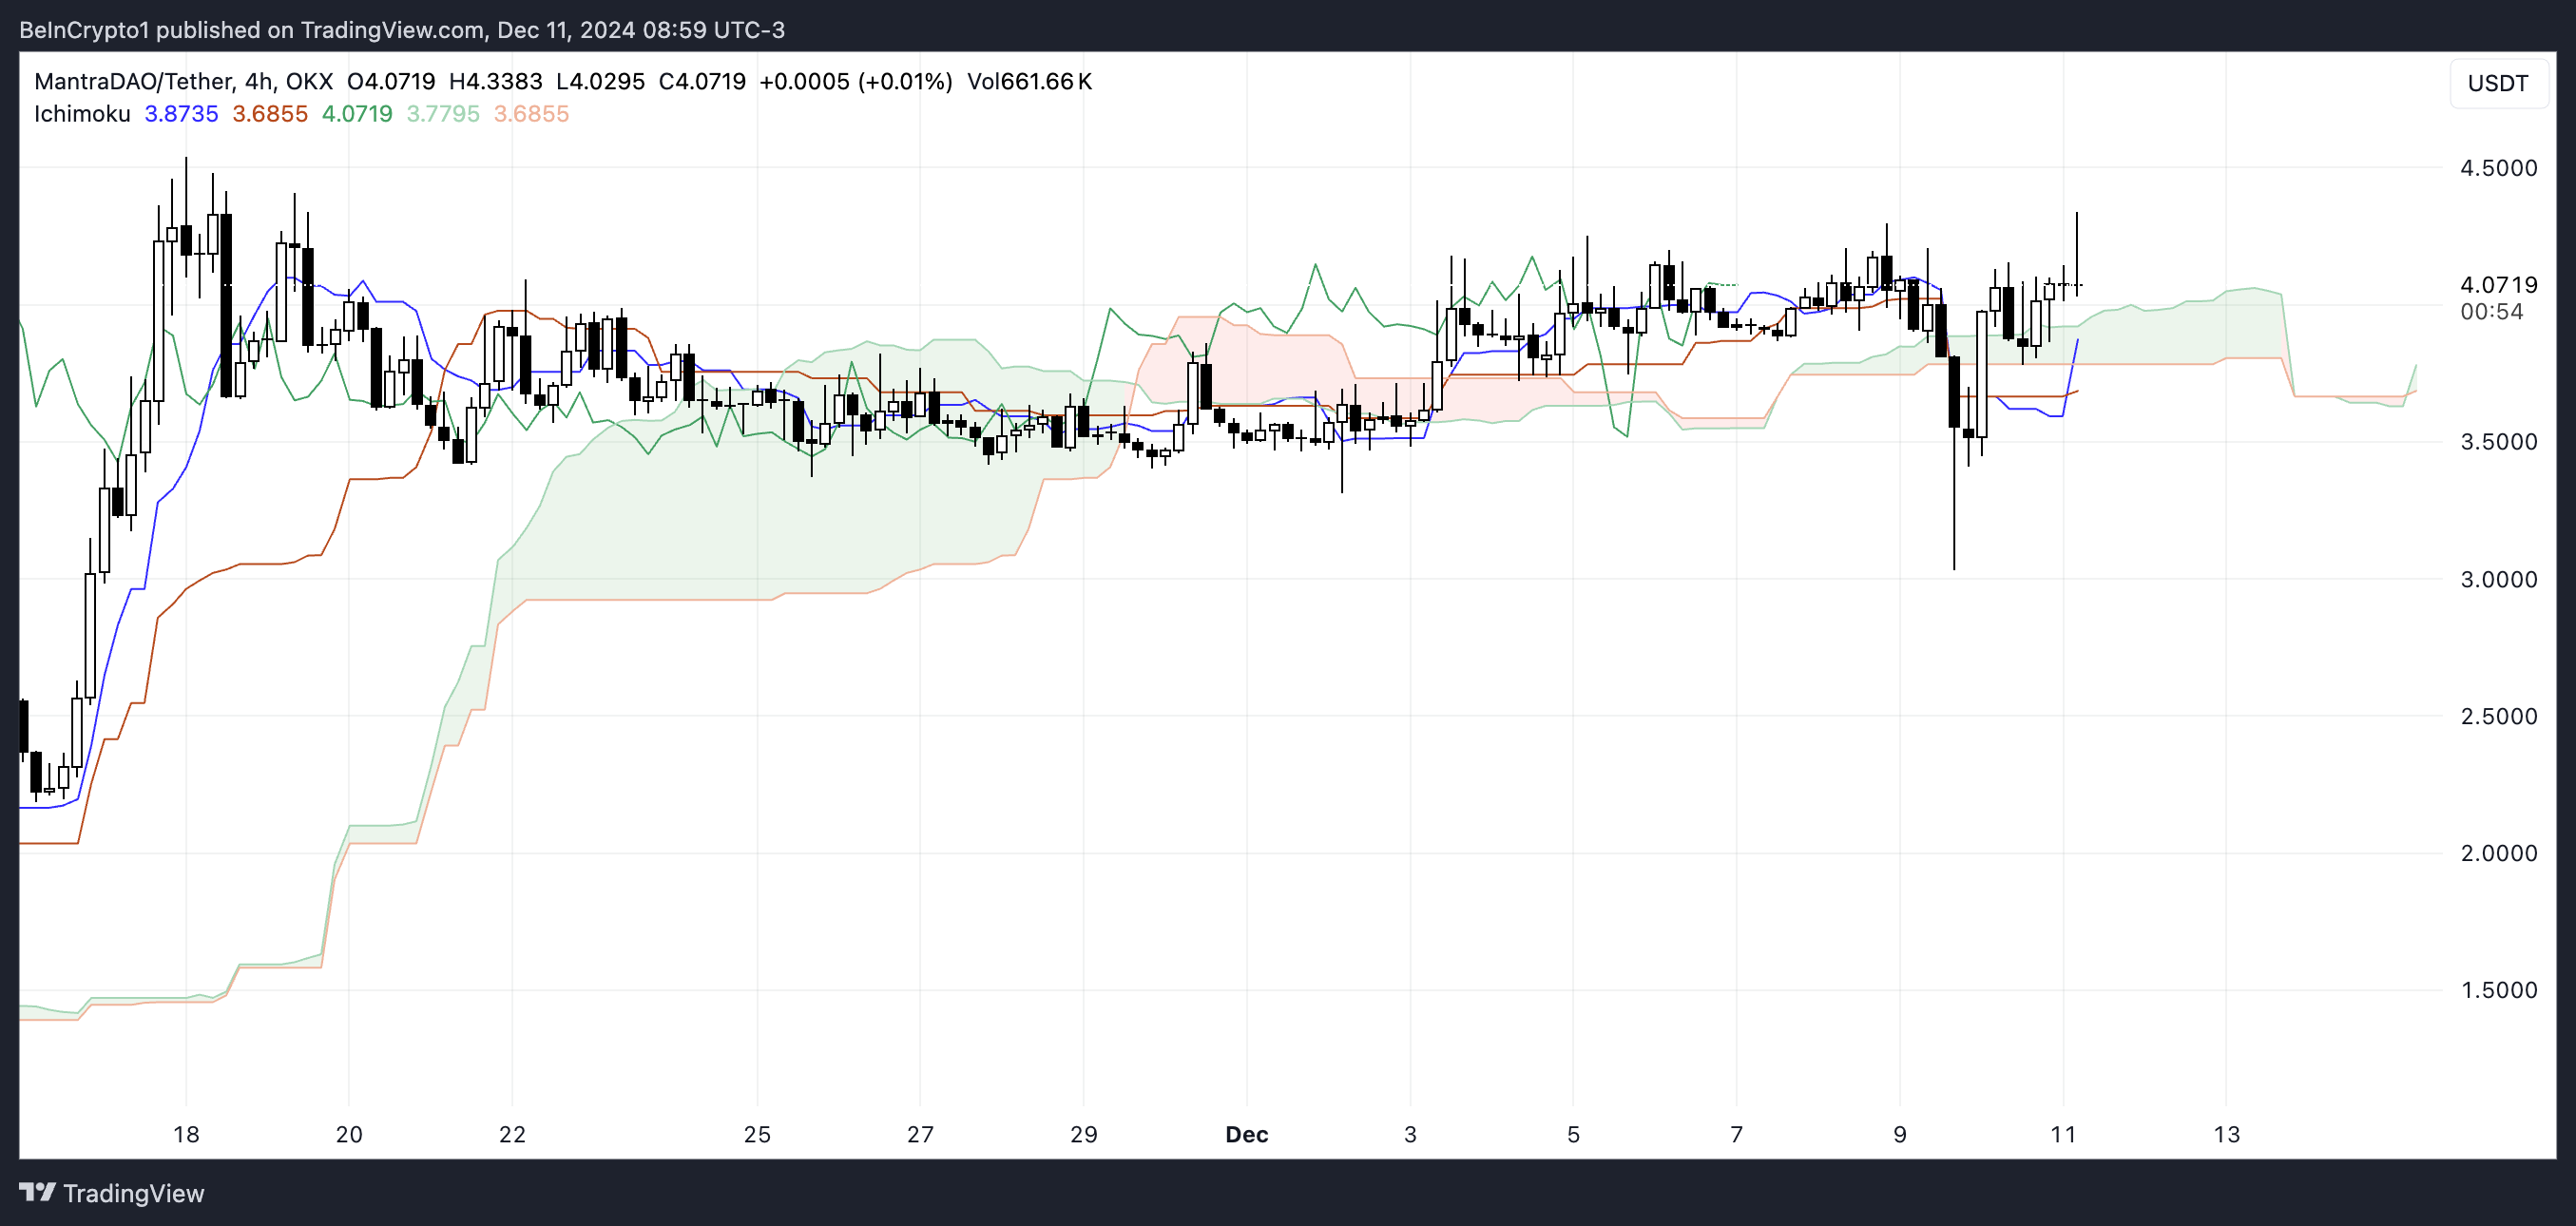
The Ichimoku Cloud is a comprehensive indicator that provides insights into trend direction, momentum, and support/resistance levels. A price above the cloud signals bullish conditions, while a price below it indicates bearish sentiment. With OM trading above the cloud but experiencing weak momentum, the trend may consolidate.
To confirm a stronger uptrend, the price needs to stay above the cloud while the Tenkan-sen crosses back above the Kijun-sen, signaling renewed bullish energy. If the price falls below the cloud, it could shift the trend to bearish, targeting lower support levels.
OM Price Prediction: A New All-Time High Soon?
OM’s Exponential Moving Average (EMA) lines currently indicate a bullish trend, with shorter EMAs positioned above longer ones.
However, the narrowing distance between the EMAs suggests a weakening momentum, signaling that the trend could change soon. This reflects growing uncertainty in the market as buyers and sellers compete for dominance.
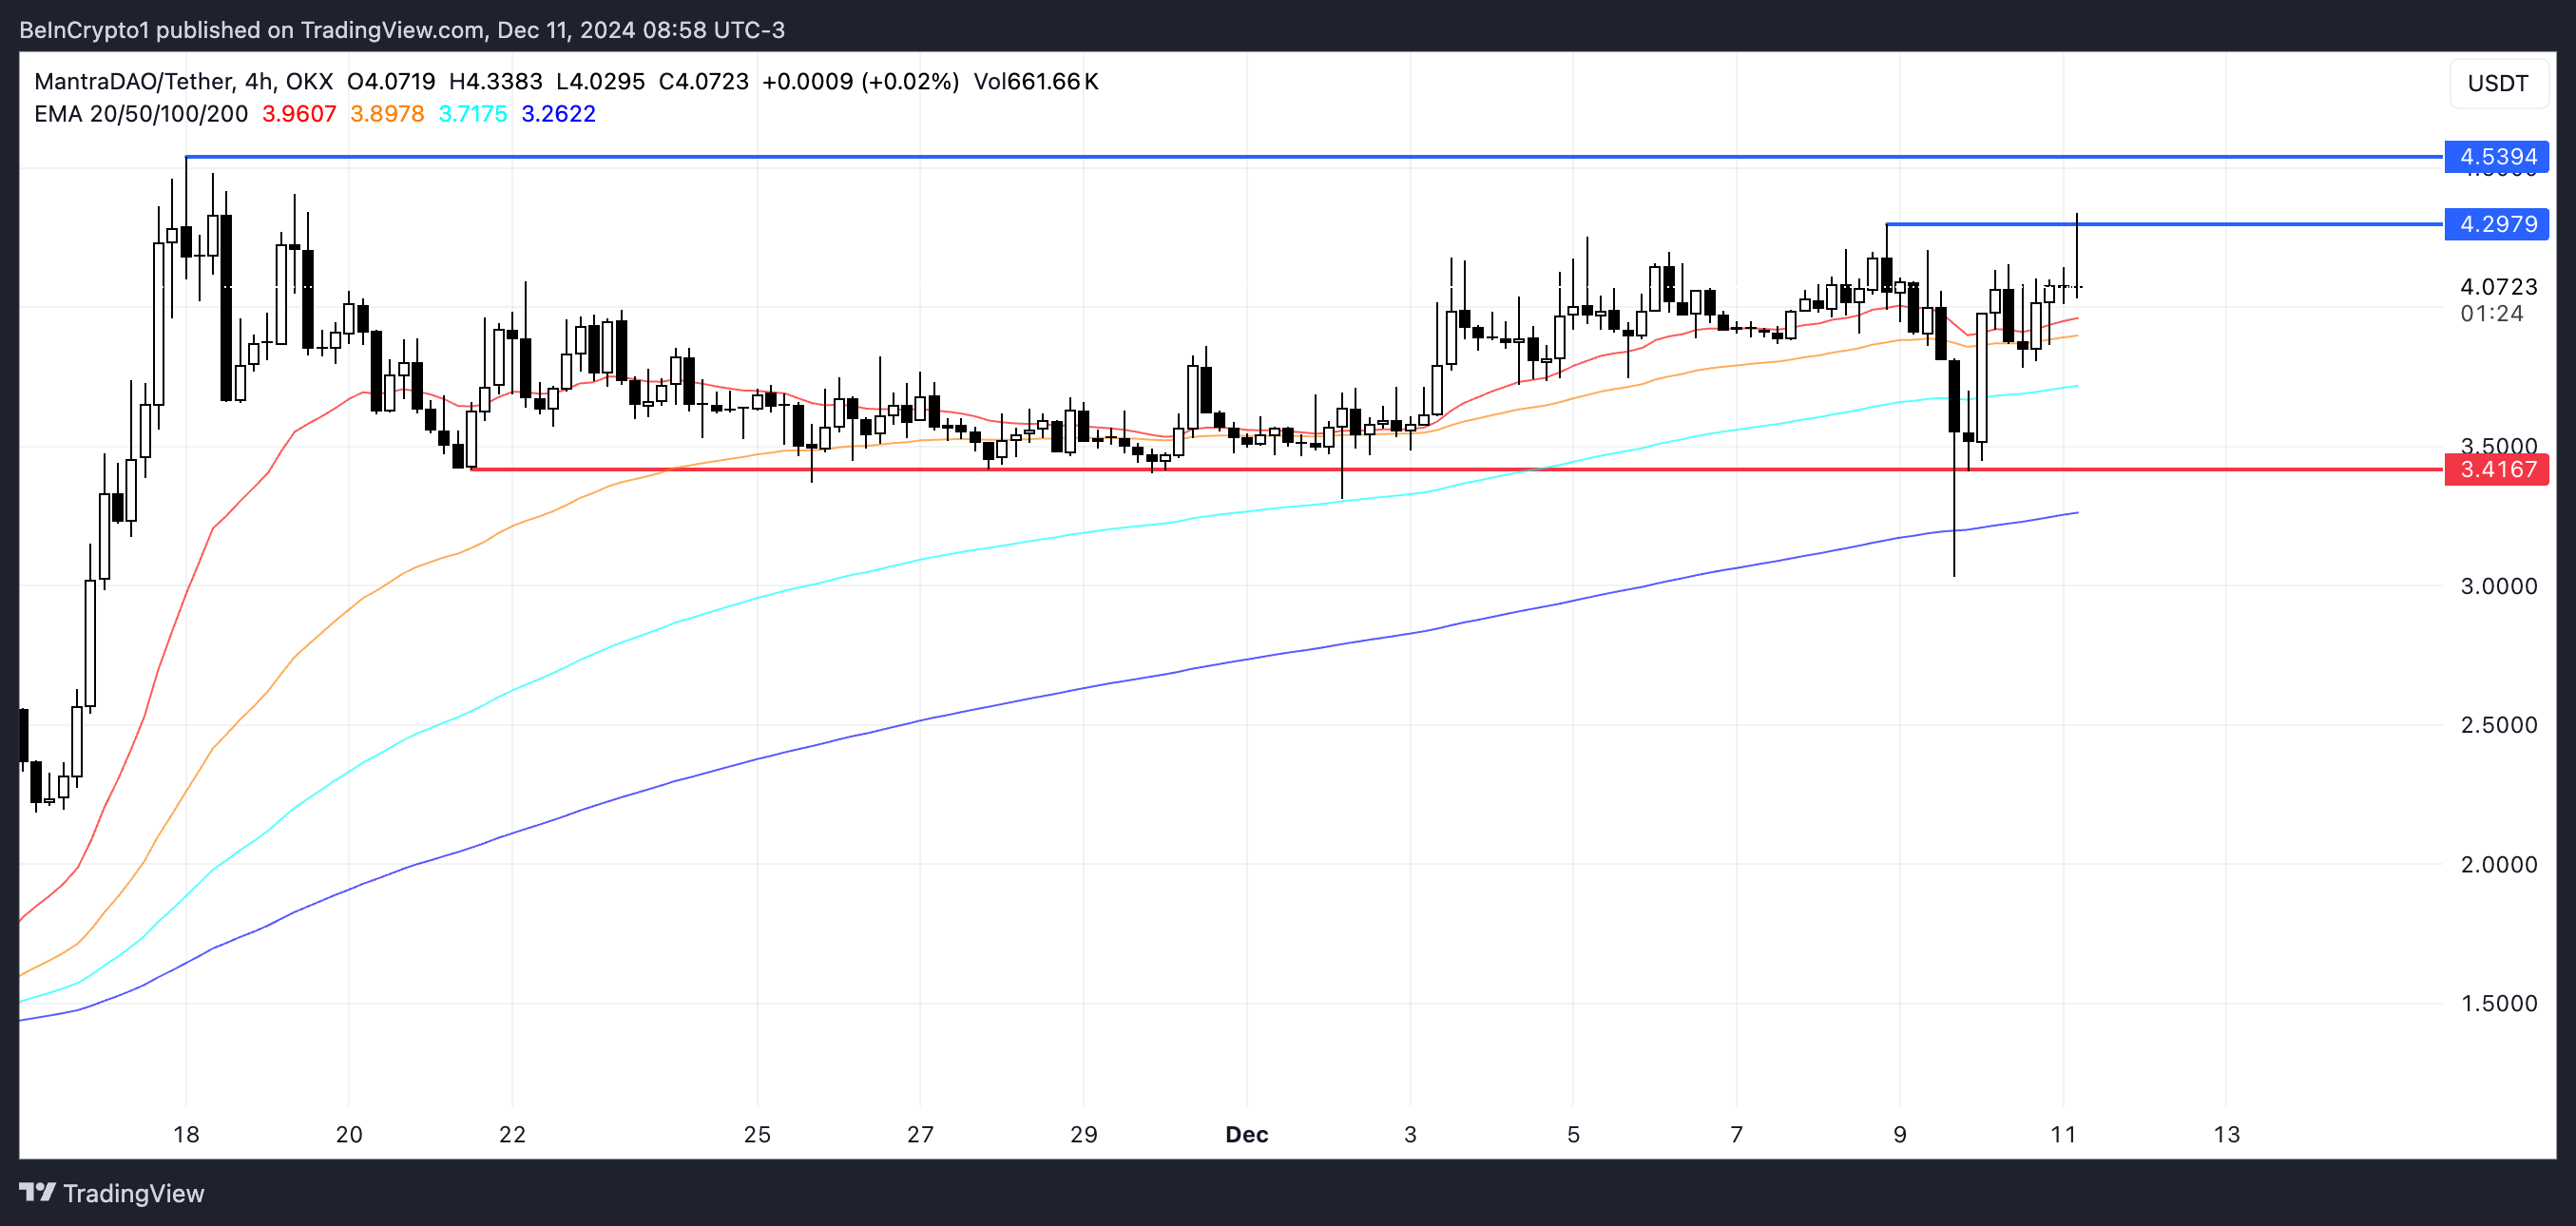
If the uptrend continues, OM could rise to test resistance at $4.29, and a break above this level could push it toward $4.53, marking new all-time highs and establishing Mantra as one of the leaders among RWA coins.
On the other hand, if a downtrend develops, OM price might test support at $3.41, representing a potential 16% decline. The narrowing EMA gap shows the importance of closely monitoring price movements for signs of a breakout or breakdown.
Disclaimer: Investing carries risk. This is not financial advice. The above content should not be regarded as an offer, recommendation, or solicitation on acquiring or disposing of any financial products, any associated discussions, comments, or posts by author or other users should not be considered as such either. It is solely for general information purpose only, which does not consider your own investment objectives, financial situations or needs. TTM assumes no responsibility or warranty for the accuracy and completeness of the information, investors should do their own research and may seek professional advice before investing.
Most Discussed
- 1
- 2
- 3
- 4
- 5
- 6
- 7
- 8
- 9
- 10