Raydium Dominates Solana DEX Volumes as RAY Price Approaches $6 Resistance
- Raydium (RAY) price skyrockets 665% in 2024, surpassing Uniswap in monthly DEX volumes with a $23 billion weekly surge.
- RAY dominates Solana DEX volumes, capturing 50% market share and generating $226M in fees over the past 30 days.
- RSI nears overbought levels as bullish EMA crossover signals potential to test resistance at $6 and beyond.
Raydium’s native token, RAY, has surged an impressive 665.45% in 2024, cementing its status as one of the year’s top-performing cryptocurrencies. The platform recently overtook Uniswap in monthly DEX volumes, fueled by a $23 billion spike within a single week.
As the dominant decentralized exchange in Solana ecosystem, Raydium continues to benefit from its market leadership and growing adoption.
Raydium Is Now One of the Most Profitable Businesses In Crypto
Raydium has solidified its position as the leading Decentralized Exchange (DEX) in the Solana ecosystem, achieving a staggering weekly volume of $23 billion between December 2 and December 9. This figure surpasses the combined volumes of its closest competitors: Orca, Pumpfun, Meteora, and Lifinity.
Raydium’s market share now accounts for nearly 50% of all DEX volumes on Solana, benefiting from the interest on meme coins.
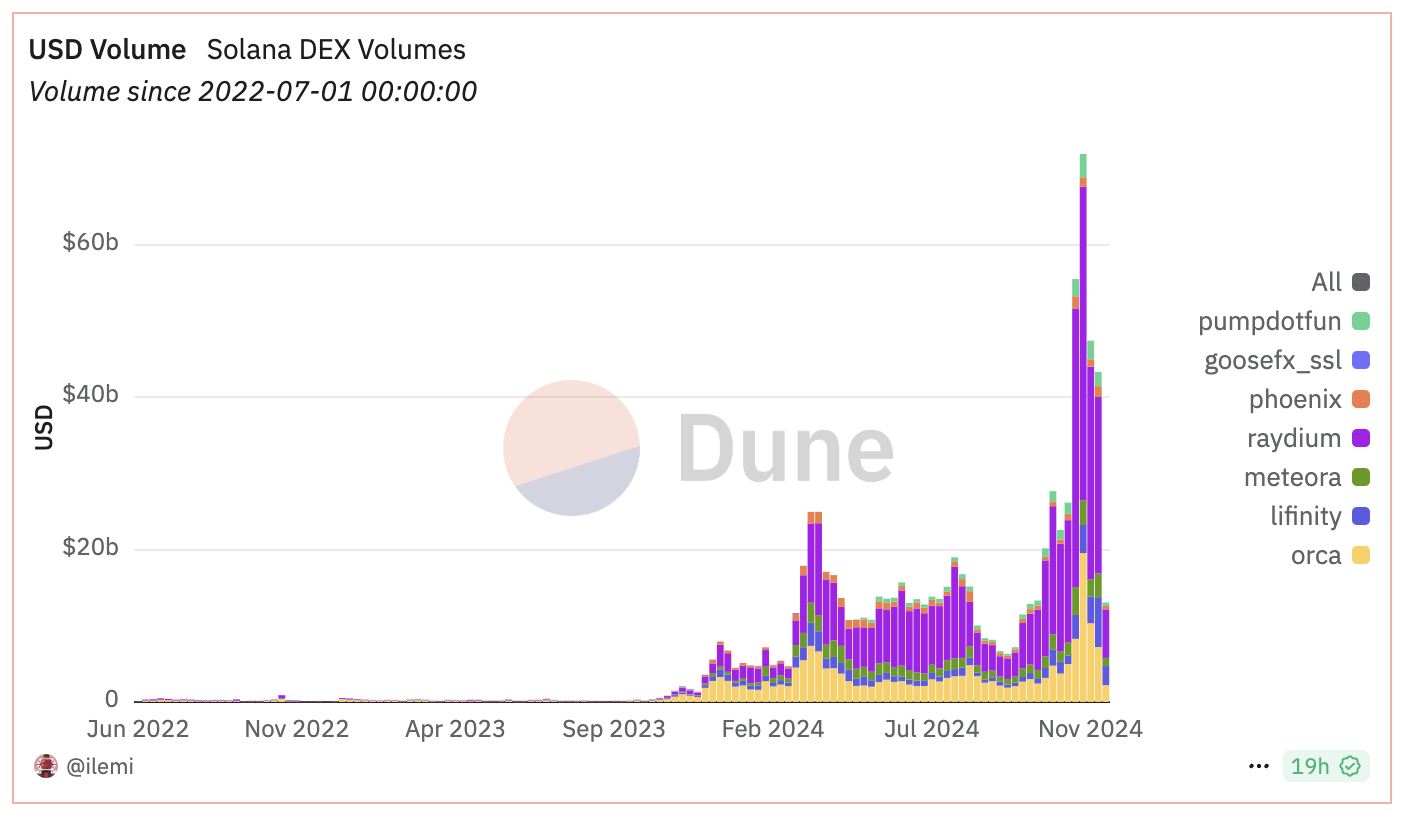
Over the past 30 days, Raydium has also generated $226 million in fees, surpassing notable platforms like Jito, Uniswap, Circle, and even Solana itself. It ranks just behind Ethereum and Tether.
With Solana’s ecosystem experiencing significant growth, Raydium’s position as its most dominant application creates strong tailwinds for its price.
RAY RSI Is Reaching Overbought Levels
Raydium Relative Strength Index (RSI) has experienced a rapid increase, climbing from 26 to 70 in under two days. This significant jump reflects strong buying momentum driven by the recent price surge.
An RSI at these levels indicates that RAY has moved from being oversold to approaching overbought territory, signaling heightened market interest and demand.
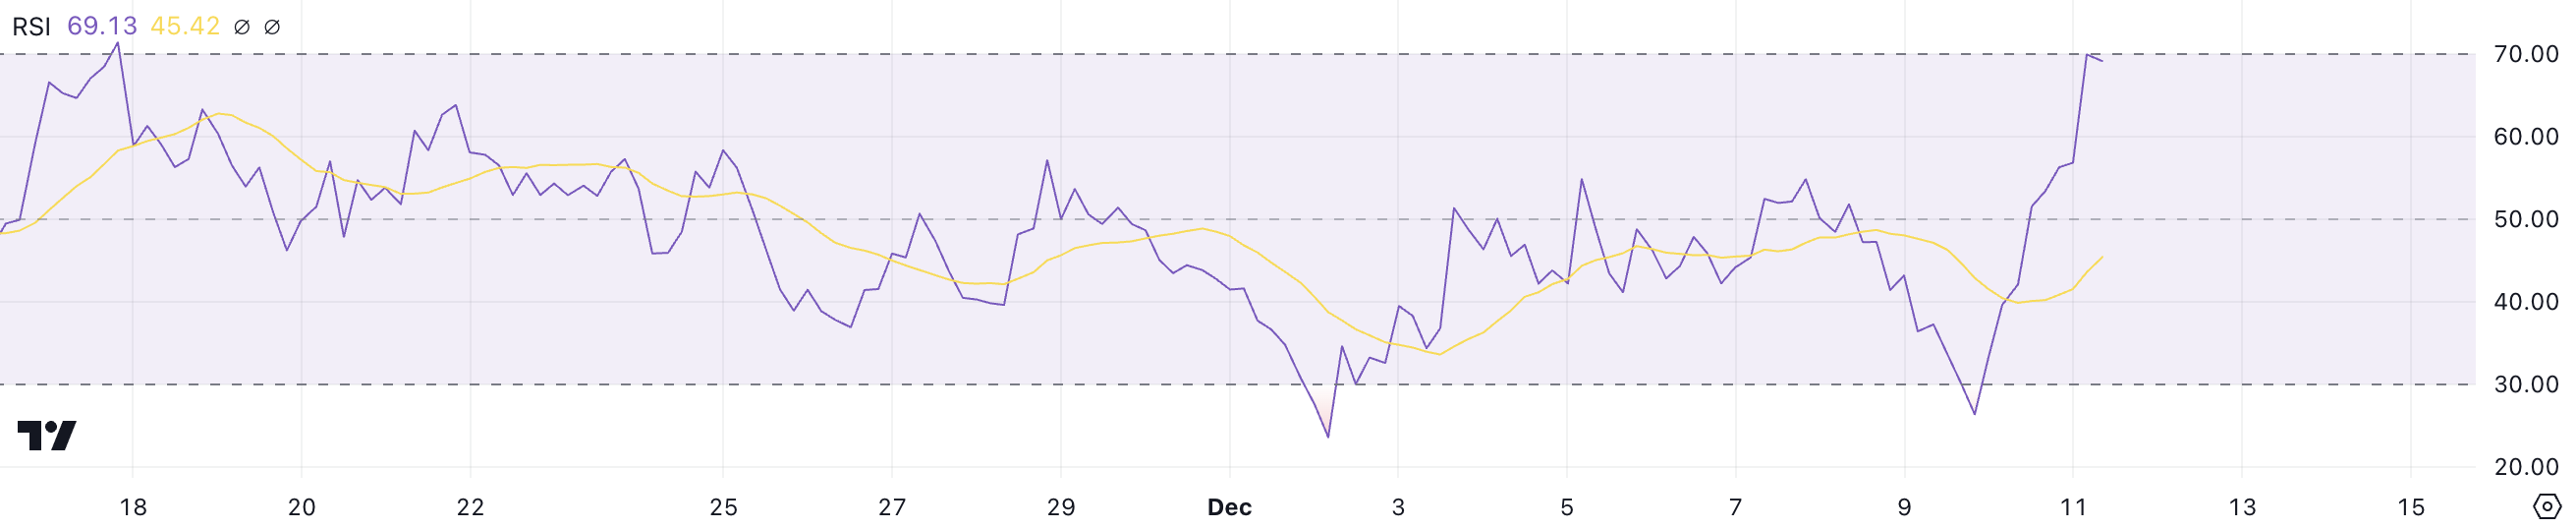
The RSI is a momentum oscillator that ranges from 0 to 100, measuring the speed and magnitude of price changes. Values below 30 suggest oversold conditions, often preceding a rebound, while values above 70 indicate overbought conditions, which can signal a potential correction.
Currently, RAY RSI is at 69, on the verge of crossing into overbought territory. If the RSI surpasses 70, it could indicate further upside potential before a pullback occurs.
Raydium Price Prediction: Will It Rise Back to $6 In December?
Raydium Exponential Moving Average (EMA) lines have displayed a unique shift in momentum. Just two days ago, they formed a death cross, with the shortest-term EMA crossing below the longest-term EMA, signaling bearish sentiment.
However, Raydium price began to recover swiftly, and the shortest EMA has now crossed back above the longest, signaling a bullish reversal. This move has coincided with a 20% price increase in the last 24 hours, highlighting the strength of the current momentum.
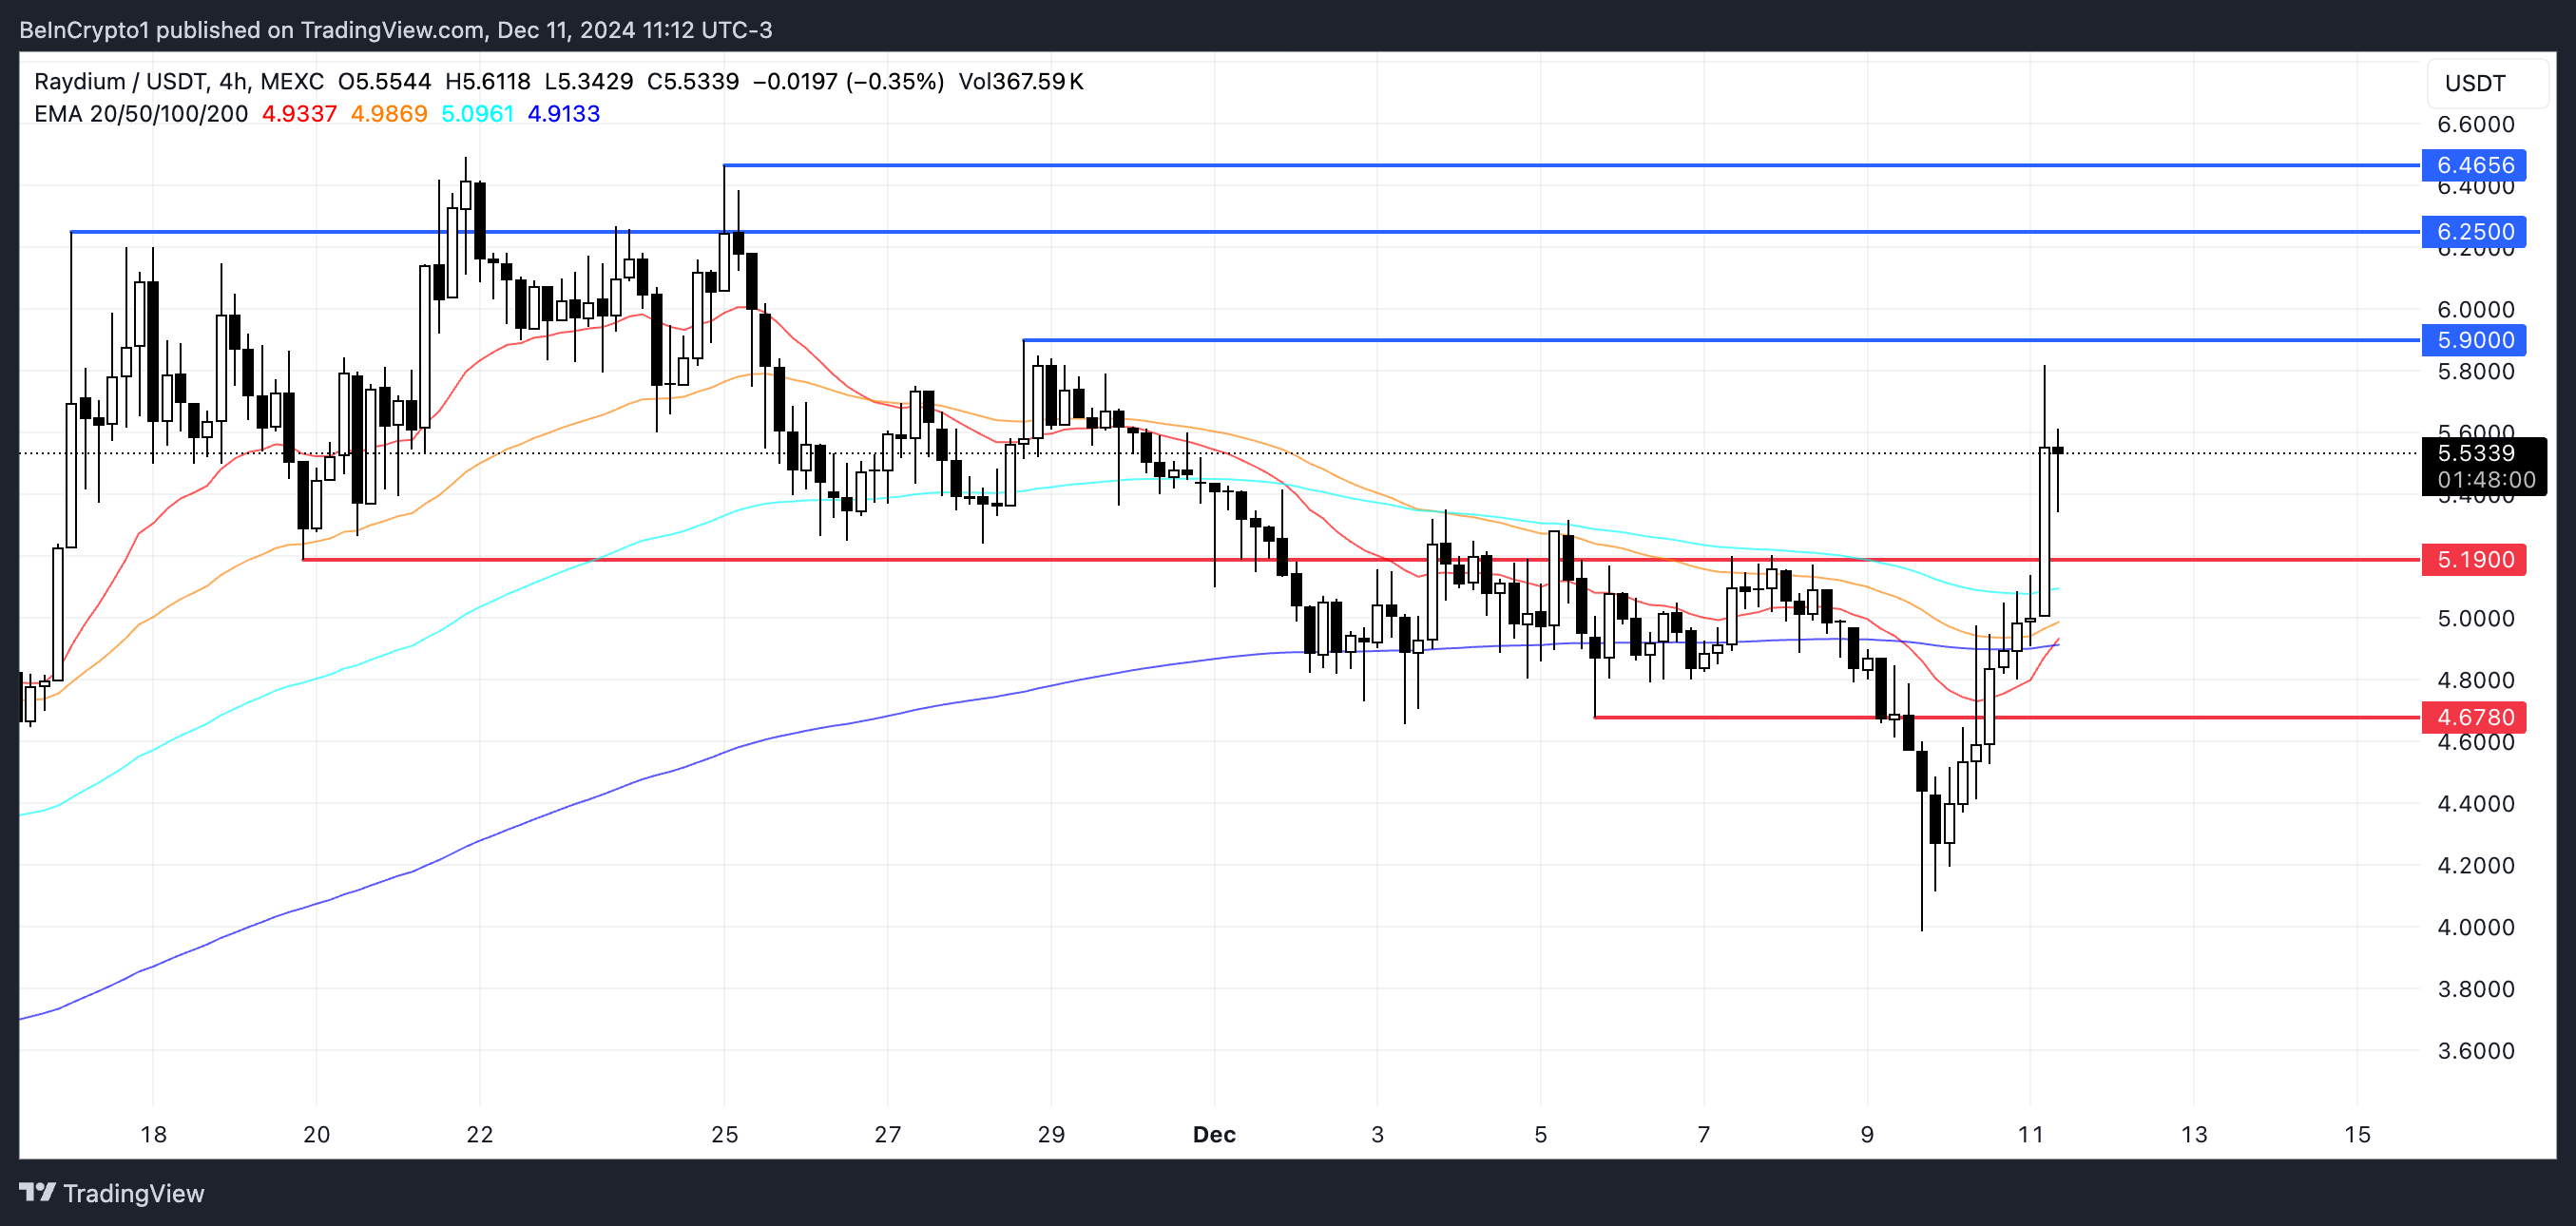
If this bullish momentum persists, RAY price could test its closest resistance at $5.9 and potentially $6.25. Breaking through these levels could lead to a further rise to $6.46, representing a possible 14% upside. That could be driven especially if meme coins continue to attract attention and become one of the leading narratives in crypto.
Conversely, if the current momentum fades, RAY might retest support at $5.19. A failure to hold at that level could drive the price down further to $4.67.
Disclaimer: Investing carries risk. This is not financial advice. The above content should not be regarded as an offer, recommendation, or solicitation on acquiring or disposing of any financial products, any associated discussions, comments, or posts by author or other users should not be considered as such either. It is solely for general information purpose only, which does not consider your own investment objectives, financial situations or needs. TTM assumes no responsibility or warranty for the accuracy and completeness of the information, investors should do their own research and may seek professional advice before investing.
Most Discussed
- 1
- 2
- 3
- 4
- 5
- 6
- 7
- 8
- 9
- 10