Fullshare Holdings' (HKG:607) Returns On Capital Not Reflecting Well On The Business
Ignoring the stock price of a company, what are the underlying trends that tell us a business is past the growth phase? More often than not, we'll see a declining return on capital employed (ROCE) and a declining amount of capital employed. This combination can tell you that not only is the company investing less, it's earning less on what it does invest. So after glancing at the trends within Fullshare Holdings (HKG:607), we weren't too hopeful.
What Is Return On Capital Employed (ROCE)?
For those that aren't sure what ROCE is, it measures the amount of pre-tax profits a company can generate from the capital employed in its business. Analysts use this formula to calculate it for Fullshare Holdings:
Return on Capital Employed = Earnings Before Interest and Tax (EBIT) ÷ (Total Assets - Current Liabilities)
0.0016 = CN¥37m ÷ (CN¥56b - CN¥32b) (Based on the trailing twelve months to June 2024).
Thus, Fullshare Holdings has an ROCE of 0.2%. In absolute terms, that's a low return and it also under-performs the Electrical industry average of 6.3%.
Check out our latest analysis for Fullshare Holdings
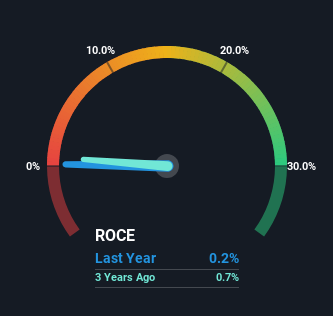
Historical performance is a great place to start when researching a stock so above you can see the gauge for Fullshare Holdings' ROCE against it's prior returns. If you'd like to look at how Fullshare Holdings has performed in the past in other metrics, you can view this free graph of Fullshare Holdings' past earnings, revenue and cash flow.
So How Is Fullshare Holdings' ROCE Trending?
In terms of Fullshare Holdings' historical ROCE movements, the trend doesn't inspire confidence. Unfortunately the returns on capital have diminished from the 1.1% that they were earning five years ago. And on the capital employed front, the business is utilizing roughly the same amount of capital as it was back then. Since returns are falling and the business has the same amount of assets employed, this can suggest it's a mature business that hasn't had much growth in the last five years. So because these trends aren't typically conducive to creating a multi-bagger, we wouldn't hold our breath on Fullshare Holdings becoming one if things continue as they have.
On a side note, Fullshare Holdings' current liabilities have increased over the last five years to 57% of total assets, effectively distorting the ROCE to some degree. Without this increase, it's likely that ROCE would be even lower than 0.2%. And with current liabilities at these levels, suppliers or short-term creditors are effectively funding a large part of the business, which can introduce some risks.
The Bottom Line
In the end, the trend of lower returns on the same amount of capital isn't typically an indication that we're looking at a growth stock. Unsurprisingly then, the stock has dived 94% over the last five years, so investors are recognizing these changes and don't like the company's prospects. With underlying trends that aren't great in these areas, we'd consider looking elsewhere.
On a final note, we've found 2 warning signs for Fullshare Holdings that we think you should be aware of.
If you want to search for solid companies with great earnings, check out this free list of companies with good balance sheets and impressive returns on equity.
New: AI Stock Screener & Alerts
Our new AI Stock Screener scans the market every day to uncover opportunities.
• Dividend Powerhouses (3%+ Yield)• Undervalued Small Caps with Insider Buying• High growth Tech and AI CompaniesOr build your own from over 50 metrics.
Explore Now for FreeHave feedback on this article? Concerned about the content? Get in touch with us directly. Alternatively, email editorial-team (at) simplywallst.com.This article by Simply Wall St is general in nature. We provide commentary based on historical data and analyst forecasts only using an unbiased methodology and our articles are not intended to be financial advice. It does not constitute a recommendation to buy or sell any stock, and does not take account of your objectives, or your financial situation. We aim to bring you long-term focused analysis driven by fundamental data. Note that our analysis may not factor in the latest price-sensitive company announcements or qualitative material. Simply Wall St has no position in any stocks mentioned.
Disclaimer: Investing carries risk. This is not financial advice. The above content should not be regarded as an offer, recommendation, or solicitation on acquiring or disposing of any financial products, any associated discussions, comments, or posts by author or other users should not be considered as such either. It is solely for general information purpose only, which does not consider your own investment objectives, financial situations or needs. TTM assumes no responsibility or warranty for the accuracy and completeness of the information, investors should do their own research and may seek professional advice before investing.
Most Discussed
- 1
- 2
- 3
- 4
- 5
- 6
- 7
- 8
- 9
- 10