Is Man Wah Holdings Limited (HKG:1999) Trading At A 43% Discount?
Key Insights
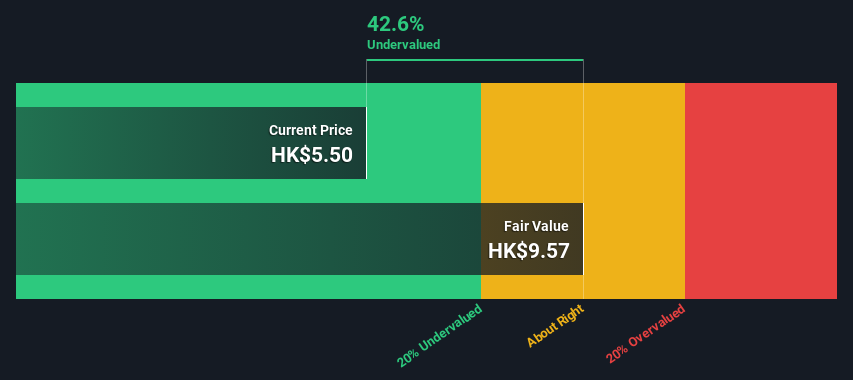
- Using the 2 Stage Free Cash Flow to Equity, Man Wah Holdings fair value estimate is HK$9.57
- Current share price of HK$5.50 suggests Man Wah Holdings is potentially 43% undervalued
- The HK$7.55 analyst price target for 1999 is 21% less than our estimate of fair value
In this article we are going to estimate the intrinsic value of Man Wah Holdings Limited (HKG:1999) by taking the expected future cash flows and discounting them to today's value. We will take advantage of the Discounted Cash Flow (DCF) model for this purpose. Don't get put off by the jargon, the math behind it is actually quite straightforward.
We generally believe that a company's value is the present value of all of the cash it will generate in the future. However, a DCF is just one valuation metric among many, and it is not without flaws. If you still have some burning questions about this type of valuation, take a look at the Simply Wall St analysis model.
See our latest analysis for Man Wah Holdings
Step By Step Through The Calculation
We are going to use a two-stage DCF model, which, as the name states, takes into account two stages of growth. The first stage is generally a higher growth period which levels off heading towards the terminal value, captured in the second 'steady growth' period. To begin with, we have to get estimates of the next ten years of cash flows. Where possible we use analyst estimates, but when these aren't available we extrapolate the previous free cash flow (FCF) from the last estimate or reported value. We assume companies with shrinking free cash flow will slow their rate of shrinkage, and that companies with growing free cash flow will see their growth rate slow, over this period. We do this to reflect that growth tends to slow more in the early years than it does in later years.
A DCF is all about the idea that a dollar in the future is less valuable than a dollar today, so we discount the value of these future cash flows to their estimated value in today's dollars:
10-year free cash flow (FCF) forecast
| 2025 | 2026 | 2027 | 2028 | 2029 | 2030 | 2031 | 2032 | 2033 | 2034 | |
| Levered FCF (HK$, Millions) | HK$1.89b | HK$2.12b | HK$2.36b | HK$2.54b | HK$2.70b | HK$2.83b | HK$2.95b | HK$3.05b | HK$3.15b | HK$3.25b |
| Growth Rate Estimate Source | Analyst x2 | Analyst x2 | Analyst x1 | Est @ 7.65% | Est @ 6.06% | Est @ 4.94% | Est @ 4.16% | Est @ 3.62% | Est @ 3.23% | Est @ 2.97% |
| Present Value (HK$, Millions) Discounted @ 9.1% | HK$1.7k | HK$1.8k | HK$1.8k | HK$1.8k | HK$1.7k | HK$1.7k | HK$1.6k | HK$1.5k | HK$1.4k | HK$1.4k |
("Est" = FCF growth rate estimated by Simply Wall St)Present Value of 10-year Cash Flow (PVCF) = HK$16b
The second stage is also known as Terminal Value, this is the business's cash flow after the first stage. For a number of reasons a very conservative growth rate is used that cannot exceed that of a country's GDP growth. In this case we have used the 5-year average of the 10-year government bond yield (2.3%) to estimate future growth. In the same way as with the 10-year 'growth' period, we discount future cash flows to today's value, using a cost of equity of 9.1%.
Terminal Value (TV)= FCF2034 × (1 + g) ÷ (r – g) = HK$3.2b× (1 + 2.3%) ÷ (9.1%– 2.3%) = HK$49b
Present Value of Terminal Value (PVTV)= TV / (1 + r)10= HK$49b÷ ( 1 + 9.1%)10= HK$21b
The total value, or equity value, is then the sum of the present value of the future cash flows, which in this case is HK$37b. In the final step we divide the equity value by the number of shares outstanding. Compared to the current share price of HK$5.5, the company appears quite good value at a 43% discount to where the stock price trades currently. Remember though, that this is just an approximate valuation, and like any complex formula - garbage in, garbage out.
The Assumptions
The calculation above is very dependent on two assumptions. The first is the discount rate and the other is the cash flows. Part of investing is coming up with your own evaluation of a company's future performance, so try the calculation yourself and check your own assumptions. The DCF also does not consider the possible cyclicality of an industry, or a company's future capital requirements, so it does not give a full picture of a company's potential performance. Given that we are looking at Man Wah Holdings as potential shareholders, the cost of equity is used as the discount rate, rather than the cost of capital (or weighted average cost of capital, WACC) which accounts for debt. In this calculation we've used 9.1%, which is based on a levered beta of 1.391. Beta is a measure of a stock's volatility, compared to the market as a whole. We get our beta from the industry average beta of globally comparable companies, with an imposed limit between 0.8 and 2.0, which is a reasonable range for a stable business.
SWOT Analysis for Man Wah Holdings
- Earnings growth over the past year exceeded the industry.
- Debt is not viewed as a risk.
- Dividends are covered by earnings and cash flows.
- Dividend information for 1999.
- Dividend is low compared to the top 25% of dividend payers in the Consumer Durables market.
- Annual earnings are forecast to grow for the next 3 years.
- Trading below our estimate of fair value by more than 20%.
- Annual earnings are forecast to grow slower than the Hong Kong market.
- What else are analysts forecasting for 1999?
Next Steps:
Although the valuation of a company is important, it is only one of many factors that you need to assess for a company. It's not possible to obtain a foolproof valuation with a DCF model. Rather it should be seen as a guide to "what assumptions need to be true for this stock to be under/overvalued?" For instance, if the terminal value growth rate is adjusted slightly, it can dramatically alter the overall result. What is the reason for the share price sitting below the intrinsic value? For Man Wah Holdings, we've compiled three essential factors you should further examine:
- Risks: Take risks, for example - Man Wah Holdings has 1 warning sign we think you should be aware of.
- Future Earnings: How does 1999's growth rate compare to its peers and the wider market? Dig deeper into the analyst consensus number for the upcoming years by interacting with our free analyst growth expectation chart.
- Other Solid Businesses: Low debt, high returns on equity and good past performance are fundamental to a strong business. Why not explore our interactive list of stocks with solid business fundamentals to see if there are other companies you may not have considered!
PS. Simply Wall St updates its DCF calculation for every Hong Kong stock every day, so if you want to find the intrinsic value of any other stock just search here.
New: Manage All Your Stock Portfolios in One Place
We've created the ultimate portfolio companion for stock investors, and it's free.
• Connect an unlimited number of Portfolios and see your total in one currency• Be alerted to new Warning Signs or Risks via email or mobile• Track the Fair Value of your stocks
Try a Demo Portfolio for FreeHave feedback on this article? Concerned about the content? Get in touch with us directly. Alternatively, email editorial-team (at) simplywallst.com.This article by Simply Wall St is general in nature. We provide commentary based on historical data and analyst forecasts only using an unbiased methodology and our articles are not intended to be financial advice. It does not constitute a recommendation to buy or sell any stock, and does not take account of your objectives, or your financial situation. We aim to bring you long-term focused analysis driven by fundamental data. Note that our analysis may not factor in the latest price-sensitive company announcements or qualitative material. Simply Wall St has no position in any stocks mentioned.
Disclaimer: Investing carries risk. This is not financial advice. The above content should not be regarded as an offer, recommendation, or solicitation on acquiring or disposing of any financial products, any associated discussions, comments, or posts by author or other users should not be considered as such either. It is solely for general information purpose only, which does not consider your own investment objectives, financial situations or needs. TTM assumes no responsibility or warranty for the accuracy and completeness of the information, investors should do their own research and may seek professional advice before investing.
Most Discussed
- 1
- 2
- 3
- 4
- 5
- 6
- 7
- 8
- 9
- 10